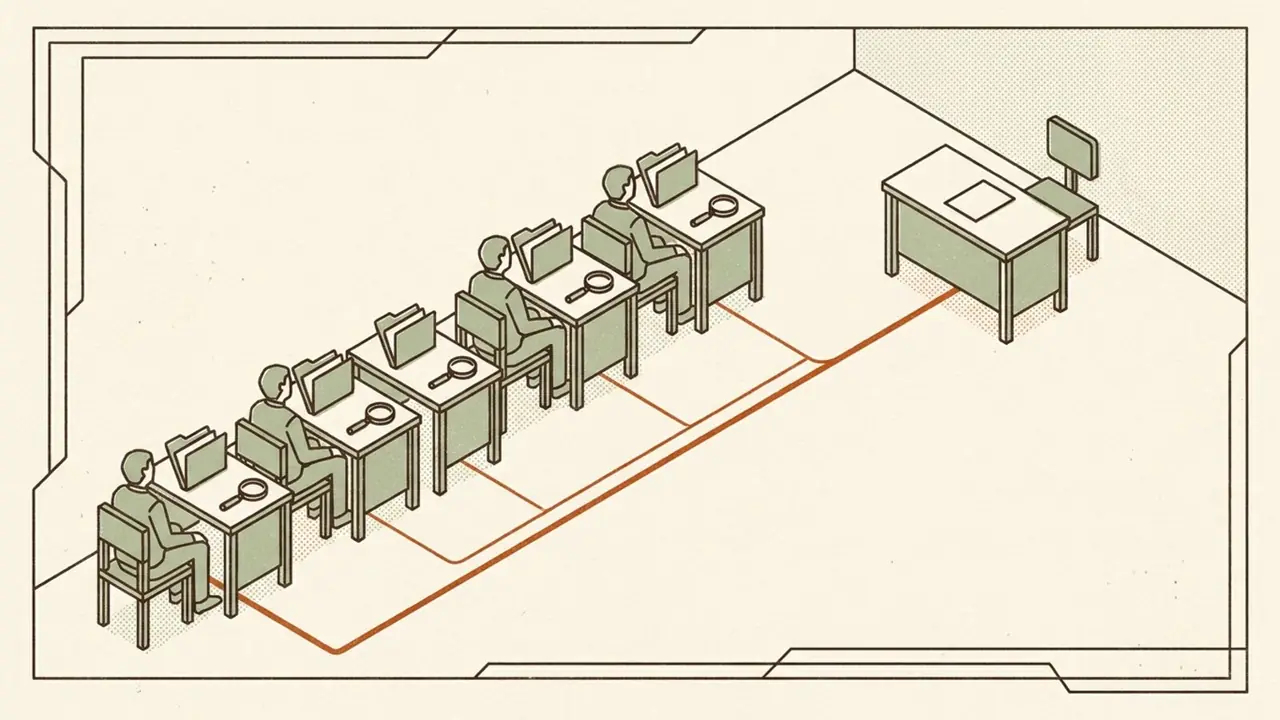
Same two disclaimers as last time, then the team.
This is my own lab. It is nested, it runs on hardware I paid for, the licensing is evaluation-tier, and nothing in it has ever been near a customer or an employer's network. I put that at the top so you do not have to wonder about it on the way down.
The second disclaimer is the article. What I built is the front half of a loop. The back half, where something asks my permission and changes something, is on the page in grey and labeled planned. So every investigation this system has ever finished has ended with the same two words: needs_human. There is no resolved. There is nowhere in the code to put one.
I wanted a team, not a dashboard
I have several dashboards. They are extremely good at telling me the lab has problems, and I have never once caught one of them fixing anything.
What I wanted was a team: six specialists who go and look with the narrowest credentials that will do the job, and send me only the part that genuinely needs a human. Me at the top of the escalation chain, and nowhere else in it.
The button I wanted to build says Agent, go ahead. The button I built says go look. This is the story of the difference.
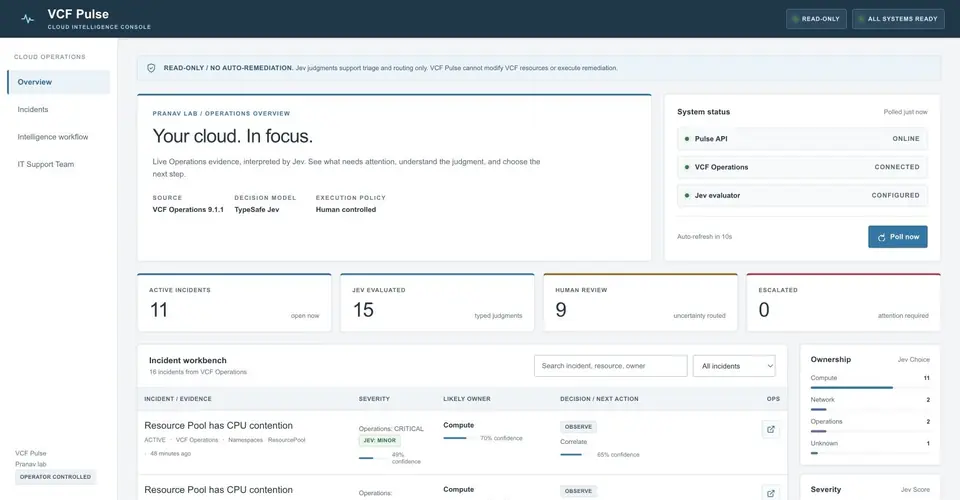
The new hires do not get keys
It is called VCF Pulse, and it is smaller than the name. One Python service, one replica, one gigabyte of storage, running inside the VKS guest cluster on the nested lab. It logs into VCF Operations 9.1.1 as a local user holding exactly one role, ReadOnly, over every object. The deployment script refuses to run as any other username, and I wrote that refusal for a version of me at midnight who would absolutely have typed admin to get the demo working.
Every sixty seconds it asks Operations for the active alerts, the resource behind each one, and ten metrics I actually look at first when something is wrong.
There is no write endpoint. Not disabled, not gated, not behind a flag: there is nowhere to put a mutation even if I wanted one. Every judgment it records carries auto_remediation: false, and so does the health endpoint, whether you asked or not. I made the interface label its own honesty, because I do not trust myself in a demo.
Jev decides who owns it, and nothing else
Here is the first judgment the system ever made on a live alert. The alert was Adapter instance object has error status, on the Supervisor cluster object. Jev came back with owner Operations, severity Material, next step Inspect resource, and a disposition of Human review, because its confidence in that next step fell below the threshold I had set.
It declined to be sure. That was the first time I trusted it a little.
Jev is a typed-judgment model from TypeSafe, and you do not chat with it. You hand it a compact structured state and seven typed questions in one call: owner, severity, cause or symptom, duplicate, safe next step, page someone or not, and which step. Back comes one answer each, the choices and the severity carrying a confidence. It never sees credentials, tokens, or log bodies.
And then Jev is done. It does not route, it does not act, and it does not decide what the page says. That is ordinary code in policy.py: owner confidence clears 0.55, paging a human clears 0.80, and out comes one of four display words. The docstring says those thresholds must be calibrated against labeled incidents from this lab. They have not been. I wrote it so a future version of me could not pretend otherwise.
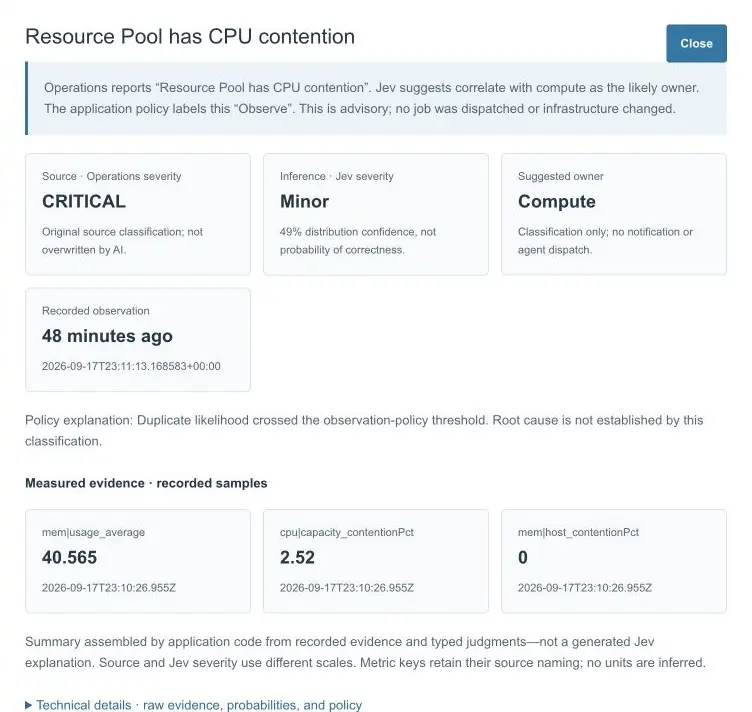
This is the dialog I keep opening. Operations raised Resource Pool has CPU contention at CRITICAL. Jev read the same evidence and said Minor, at 49 percent, owner Compute, and the policy code labeled it Observe because the duplicate probability crossed its threshold. Under that sit the numbers that matter: CPU contention 2.52 percent, memory usage 40.565, host memory contention 0. Jev never wrote me a paragraph. I want three numbers and a probability, and the source severity left where Operations put it.
A metric timestamp ticking over is not a new incident, so the key deciding whether Jev gets called again ignores sample values entirely. Fifteen incidents evaluated in that screenshot, one call each, and an unchanged poll spends nothing. It is the cheapest AI I have ever run.
Six specialists, and not one of them has a key
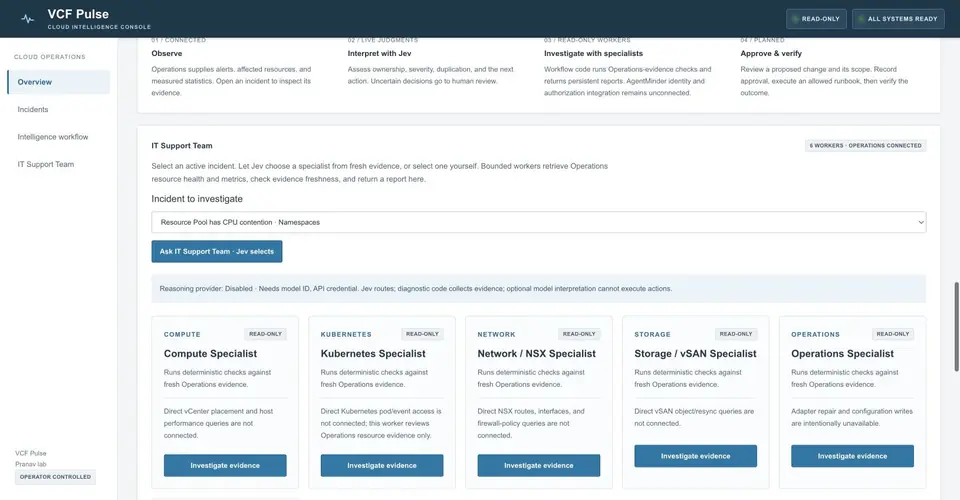
Compute, Kubernetes, Network and NSX, Storage and vSAN, Operations, Platform Services. Every card says READ-ONLY, and every card has a sentence I made it say. The Kubernetes one is my favorite: Direct Kubernetes pod/event access is not connected; this worker reviews Operations resource evidence only. The Kubernetes specialist cannot see Kubernetes. It says so. It is the most honest employee I have ever had.
Underneath they are six deterministic profiles in one process, with no credentials of their own, each reading only the metric keys carrying its own prefix. Not six hosted models. Six opinions about which numbers to look at first.
Any non-zero pressure signal gets flagged with this alone does not establish severity or root cause bolted to it. And when a specialist finds no samples for its domain, it does not say "looks fine." It says: This is insufficient evidence, not a healthy result. I have been burned by the other kind of tool.
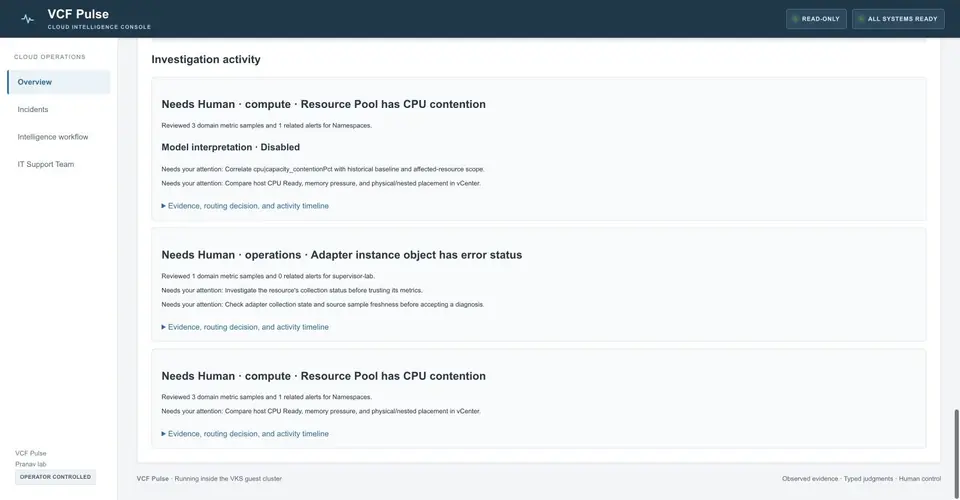
Then it writes the note. needs_human. Root cause established: false. Changes executed: false. On every report, forever, until I build the thing that can change something.
I built a team of six and the first thing every one of them learned to say was "ask a human." I am the human. I have read every note.
Three investigations have finished, and only one is the receipt I care about. Press Ask IT Support Team · Jev selects and Jev picks the owner from fresh evidence if its confidence clears 0.55, and abstains below that. On the CPU contention alert it chose compute at 0.67; that specialist pulled three metric samples and one related alert, then asked me to compare host CPU Ready, memory pressure, and physical-versus-nested placement in vCenter. It asked me to do what I would have done, in the order I would have done it, then stopped and waited. The other two reports are me picking the specialist by hand. One Jev-routed run proves one Jev-routed run.
The night the team could not help
While I was building this, the cluster it runs on got slow.
Not Pulse. Pulse was using 43 megabytes of memory and about six millicores of CPU, roughly the footprint of a sticky note. The guest cluster's control plane was running at 94 to 96 percent of its allocatable memory. Every kubectl felt like it was being answered by someone walking up a flight of stairs.
So here is the joke, and I promise I did not plan it as a demo. I was building a support team to notice memory pressure, on a control plane that was out of memory, and the one specialist who might have pointed at it is the Kubernetes one, whose card politely explains that it cannot see pods or events. Stage four, approve and verify, happened the way stage four currently happens. It was me. It was late.
The fix was the supported one, because the unsupported ones are so tempting. I moved the control plane up a VM class with a vmClass override only under the Cluster's control-plane topology variable, and let VKS and Cluster API do what they are for: build the new machine, move etcd, drain and delete the old one. I did not resize a VM in vCenter. A few seconds of API timeouts, then one healthy member, two nodes Ready, and the new control plane sitting at 27 percent of its memory.
What it did not fix: there is still one control-plane node and one etcd member. Three replicas are next, and three replicas on one physical box are three replicas on one physical box. I said this about vSAN last time and I will keep saying it about etcd until it stops being true.
Field note: the relay was eating the ends of sentences
A short one, because it cost me a day and it is the kind of thing you find by staring at a JSON body that just stops.
The workload network cannot route to Operations, so a small TCP relay outside the cluster passes the encrypted bytes through, TLS still terminating at Operations. Its non-blocking sendall calls could raise BlockingIOError under load, and when they did, a chunk of an in-flight TLS transfer went missing and the response arrived truncated. Sometimes. Not always. Which is the worst frequency a bug can have. The fix was bounded, blocking writes. My notes say connection stability "still requires observation," which is the phrase I use when I am watching something nervously.
What it does not do
A build log that only lists wins is an advertisement, so here is the other column, in the order it bothers me.
- AgentMinder is not connected. Every report records agentMinderEnforced: false. It is a plan and a stage label.
- No direct connectors. No vCenter, vSAN, NSX, Kubernetes, or certificate probes. The specialists read Operations evidence and nothing else.
- No remediation. No runbooks, no executor, no approval flow.
- The advisory model is off and unverified. There is an adapter for an OpenAI-compatible endpoint, switched off, because I have not decided what I am willing to send out of the house. A real inference has never run.
- Uncalibrated thresholds, one Jev-routed run. The routing is an initial policy, not an accuracy claim.
- One replica, one volume, one control plane, one etcd.
- Dependencies install at every cold start, because I have not chosen a registry. There is a Dockerfile. It is unemployed.
- There is no login. The private network is the boundary. Do not put this on the internet. I mean it.
What I want for my own lab
The boring part first, because I do not get the exciting part until it holds: the image in a registry, three control-plane replicas, the poller split from the API.
Then the half I actually wanted. A coordinator that treats every alert message and every agent output as untrusted data rather than instructions. AgentMinder for agent identity, authorization bound to a stated intent, and an audit trail, wired only after I have verified its real interfaces rather than the ones I would like it to have. Scoped read-only connectors so the Kubernetes specialist can finally see Kubernetes. And only after all of that, a bounded executor: no shell, reviewed runbooks only, approval bound to one resource and one change.
The demo I want is not "the agents fixed it." It is an out-of-scope action being denied on screen, and then one small approved change with the receipt.
I wanted a team. What I have is a very careful new hire who reads everything, touches nothing, and leaves a note on my desk that says needs human. I keep reading the notes. They are right more often than I expected, and humble in exactly the places I wanted them to be humble. For now, that is the coworker I want.
The next one gets a key. Not yet.
References
- Broadcom Developer: VKS ClusterClass variables (the control-plane-only `vmClass` override) The platform
- Broadcom KB 431566 The platform
- Broadcom: Deploying a Harbor service in air-gapped VCF 9 (the registry I have not built yet) The platform
- Broadcom: AgentMinder announcement (the planned coordination and audit layer, not connected here) The platform
- TypeSafe docs (Jev typed judgments) The models
- NVIDIA NIM LLM API reference (the advisory adapter's default endpoint, unused) The models
- I wanted private AI. What I had to decide was Kubernetes Field Signal, earlier in this series
- Kubernetes on the nested VMware lab Field Signal, earlier in this series
- AgentMinder on the lab, with vDefend and Avi Field Signal, earlier in this series
- There is no cloud. It's a Dell workstation in a spare room Field Signal, earlier in this series